This is bullshit.

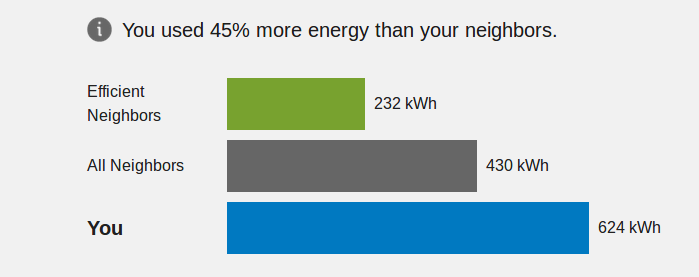
If your electricity provider is anything like mine, you’re getting notices like these too. Back when it was just Stephanie and I, we tended to sit squarely between the green and blue bars. Not anymore. Now we’re the long bar. I’m surprised with how much the gamification aspect of my power bill bothers me.
Let’s set aside the fact that I’m fairly sure my “efficient neighbors” either have solar panels or are just vacant houses. We should be doing better. We use cold water for most laundry, air dry it, have LED bulbs everywhere, the works. Even with two kids, you’d think the picture wouldn’t be so stark.
So, I want to know where this energy is really going. But I don’t want to drop hundreds of dollars for a “smart meter” or “smart breakers” to give me this information. Fortunately, there’s another cheaper, maker-project-savvy way.
Exposition time!
So, a long time ago, the power company decided it was dumb to send people walking up to everybody’s power meters to read them. So they put radio transmitters in the meters that blast out your consumption information into the aether.
So now the meter reader guy/gal just has to drive by with an antenna and slurp up the readings. Great for them, and convenient for us. It provides us with a means of reading our power meters with a computer.
What I Used
- A computer that’s on all day. I just so happen to have one, serving up this web page among other things.
- A USB radio antenna based on the RTL2832U chip. According to Amazon, the one I used is no longer sold, but this should work just as well I guess?
- This software This is a lovely little github project that provides a means of controlling the above antenna via Software-Defined Radio to listen at the specific frequency used by power meters. I can’t understate how important this was.
- A script to run rtl-amr and process the information. I used Perl, GnuPlot, and LibreOffice Calc when I couldn’t figure out how to make GnuPlot do what I wanted.
I thought that setting up software-defined radio was going to be the hard part. But I was wrong. The rtlamr sources were easy to build, the dependencies well-defined, and the executables pretty much handled all the nitty-gritty details of setting up the antenna. Once I isolated my meter from all the ones in range, it was all just a matter of collecting data. If you’re curious, ask me and I can explain the process in more detail.
Results
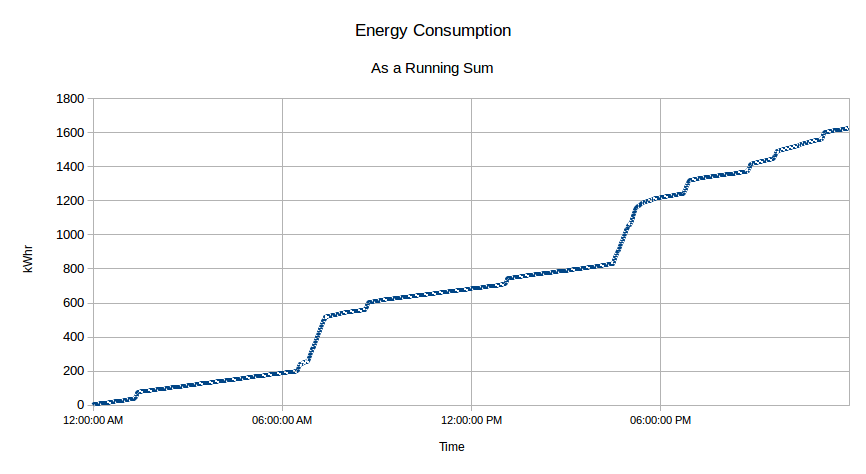
I installed the module and set up a cron job to run a single-shot sample every minute for a full day. I got this lovely graph from an average Wednesday in May.

The first thing that jumps out is that most of the big consumption periods are when all four of us are awake and in the house. I’m sure this seems obvious. But I was half afraid I’d see that my computer and the TV were chewing up tons of juice after the kids went to bed, and we’d be reduced to playing board games by candlelight to save power. It actually looks like that the post-bedtime power usage is about twice what it is in the wee hours of the morning, judging by the general slop of the line. Not bad.
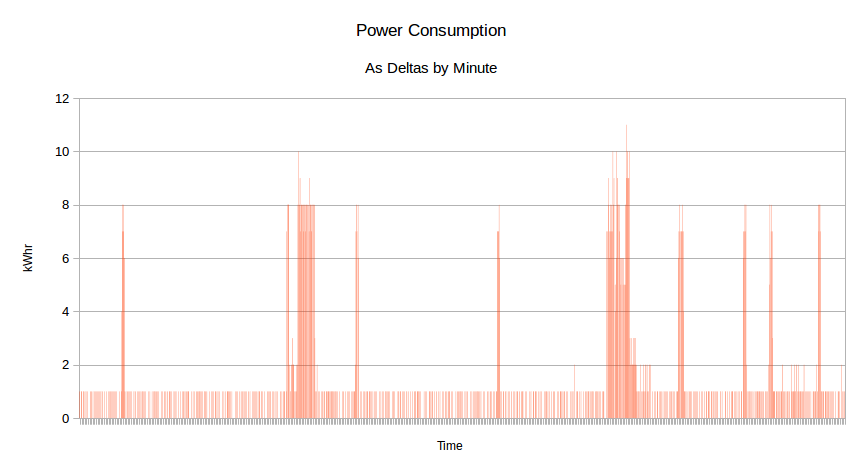
Now, let’s present the data differently. Instead of a running sum, let’s subtract each sample from the previous one to get the difference between the readings every minute.

Most of the entries in this data set are 1 or 0. We just don’t have the resolution to see fractional deltas. But check out those spikes in the middle of otherwise idle time! Those spikes, I’ve figured out, are caused by our furnace turning on every few hours to keep the forced hot water at a baseline temperature, even though it was very warm this particular day. So, there’s one lesson: turn off the furnace when it’s warm enough to not need heating.
There’s a fun data analysis lesson here. Without looking at the deltas graphed out like that, I doubt I would have noticed how sudden those jumps were (you can see them in the previous graph, but they just look like slightly steeper slopes).
Well, Now What?
So, where do I go from here? Unfortunately, this is the most resolution I can get out of this system: showing me how quickly I’m consuming power, house-wide, at any given time. There’s a real limit on what I can do with this information. But it makes a nice start, and I’m pleased with how easy software-defined radio turned out to be.
Well, if I manage to utilize this new tool to produce some sort of epiphany, you know where I’ll post it.
Aha! I smell an emergent Raspberry Pi project!! How about a kit for us non-engineers? I get exactly the same graph from the electric folks, and it tells me exactly nothing that I need to know.
Annoying at best.
And now, my vicious critical comment:
“I can’t understate how important this was.” probably means “I can’t overstate how important this was”, given the context. This is a mistake I see a lot, but most often in, of all places, the Boston Globe, which seems to instruct it’s writers to use the phrase several times a day. I complain every time, and every time I get a nice response saying, basically, “By golly, you’re right, and we’re really, really glad you read the Globe. And pay for it.”
Anyhow, try to stand up under the withering critique.
Re: project kit: Well that’s a fantastic idea. The only tricky part is finding a way to privately present this information to the user. I originally thought of just having it tweet out results like the Tweet-a-Watt does, but a miscreant could theoretically utilize this information for nefarious purposes (“Hmm, looks like Jack’s not home today”). But yes, this is something that I’ve been thinking about.
Re: grammar: SHEEEEIIIT That’s right up there with “I could care less” in terms of word crimes. I should fix it, but no. I’m going to leave it there so your comment makes sense as a warning to the next 10 generations.
I don’t understand the way it works. You get one of the little USB receiver devices, then tune it, somehow, so it gets just your data? I live in a building with a bunch of units — is there some encryption scheme that lets the electric folks read the meters as individual data streams? Is there a max distance from the meters?
So, it will work with a Pi?
Also, I’m sort of charmed that “I could care less” and “I couldn’t care less” mean the same thing.